The Stacktrace Puzzle

Don’t worry, an actual article will follow, but first: a puzzle.
Imagine you’re debugging a Python application, and you encounter the following stacktrace:
Traceback (most recent call last):
 File "example.py", line 15, in show_something                          A
    raise OriginalException()
__main__.OriginalException

During handling of the above exception, another exception occurred:

Traceback (most recent call last):
  File "example.py", line 20, in <module>                               B
    show_something()
  File "example.py", line 17, in show_something                         C
    raise_another_exception()
  File "example.py", line 10, in raise_another_exception                D
    raise AnotherException()
__main__.AnotherException
Here’s the puzzle: what is the order of execution of the lines marked A, B, C, and D?
In other words: what actually happened here?
First, try to solve the puzzle without referring to the source code. Also: don’t be scared: this stacktrace shows only 4 lines, so it can’t really be that hard, right?
Remember to set a timer…
Source code & solution
For reference, here’s the source code:
1
2
3
4
5
6
7
8
9
10
11
12
13
14
15
16
17
18
19
20
class OriginalException(Exception):
pass
class AnotherException(Exception):
pass
def raise_another_exception():
raise AnotherException()
def show_something():
try:
raise OriginalException()
except OriginalException:
raise_another_exception()
show_something()
Try to not look at the solution yet…
Referencing the source code, and with the stacktrace in mind, we can now solve the puzzle. The order of execution is as follows:
- B, line 20,
show_something() - A, line 15,
raise OriginalException() - C, line 17,
raise_another_exception() - D, line 10,
raise AnotherException()
Did you get it right? Was it easy or hard? Did you manage without looking at the source code?
No chaining
Now compare this with an example where there’s no chaining of exceptions:
Traceback (most recent call last):
  File "example.py", line 13, in <module>
    foo()
  File "example.py", line 2, in foo
    bar()
  File "example.py", line 6, in bar
    baz()
  File "example.py", line 10, in baz
    raise Exception("This is an error")
Exception: This is an error
To figure out what happened, just start reading at the top, and make your way to the bottom. In other words: the stack on screen matches the actual order of execution.
Since reading from top to bottom can be done with or without source code, the below isn’t quite necessary. But I’ve included it for completeness:
1
2
3
4
5
6
7
8
9
10
11
12
13
def foo():
bar()
def bar():
baz()
def baz():
raise Exception("This is an error")
foo()
So, what’s the point of this puzzle? Why is it interesting? And why compare it with a non-chained exception?
Unintentional puzzles
Personally, I think this puzzle is much harder than it should be. Puzzles can be great if you want to excercise your brain during downtime or to learn something new. But when you’re debugging, you want to get to the root of the problem as quickly as possible.
Note, however, that Python presents you with this puzzle every time a chained exception happens.
Note also that the example above is almost trivial, and despite that it was still quite hard. It more trivial than real-life examples in the following ways:
- Only 8 lines of code (not counting empty lines and the definition of the exceptions)
- Shallow Stacktrace (for each exception, only 3 levels deep)
- Names hint at the solution (“Original”, “Another”)
What do these things actually look like if you move out of the domain of puzzles-constructed-for-fun? A quick search for “During handling of the above exception, another exception occurred:” using my favorite search engine yields the following monstrous stacktrace from a real-life issue on GitHub. Cleaned up(!) for readability:
Traceback (most recent call last):
  File "requests\packages\urllib3\contrib\pyopenssl.py", line 277, in recv_into
    return self.connection.recv_into(*args, **kwargs)
  File "OpenSSL\SSL.py", line 1335, in recv_into
    self._raise_ssl_error(self._ssl, result)
  File "OpenSSL\SSL.py", line 1149, in _raise_ssl_error
    raise WantReadError()
OpenSSL.SSL.WantReadError

During handling of the above exception, another exception occurred:

Traceback (most recent call last):
  File "requests\packages\urllib3\contrib\pyopenssl.py", line 277, in recv_into
    return self.connection.recv_into(*args, **kwargs)
  File "OpenSSL\SSL.py", line 1335, in recv_into
    self._raise_ssl_error(self._ssl, result)
  File "OpenSSL\SSL.py", line 1166, in _raise_ssl_error
    raise SysCallError(errno, errorcode.get(errno))
OpenSSL.SSL.SysCallError: (10054, 'WSAECONNRESET')

During handling of the above exception, another exception occurred:

Traceback (most recent call last):
  File "requests\packages\urllib3\response.py", line 298, in _error_catcher
    yield
  File "requests\packages\urllib3\response.py", line 380, in read
    data = self._fp.read(amt)
  File "C:\Program Files\Anaconda3\lib\http\client.py", line 448, in read
    n = self.readinto(b)
  File "C:\Program Files\Anaconda3\lib\http\client.py", line 488, in readinto
    n = self.fp.readinto(b)
  File "C:\Program Files\Anaconda3\lib\socket.py", line 575, in readinto
    return self._sock.recv_into(b)
  File "requests\packages\urllib3\contrib\pyopenssl.py", line 293, in recv_into
    return self.recv_into(*args, **kwargs)
  File "requests\packages\urllib3\contrib\pyopenssl.py", line 282, in recv_into
    raise SocketError(str(e))
OSError: (10054, 'WSAECONNRESET')

During handling of the above exception, another exception occurred:

Traceback (most recent call last):
  File "requests\models.py", line 719, in generate
    for chunk in self.raw.stream(chunk_size, decode_content=True):
  File "requests\packages\urllib3\response.py", line 432, in stream
    data = self.read(amt=amt, decode_content=decode_content)
  File "requests\packages\urllib3\response.py", line 397, in read
    raise IncompleteRead(self._fp_bytes_read, self.length_remaining)
  File "C:\Program Files\Anaconda3\lib\contextlib.py", line 77, in __exit__
    self.gen.throw(type, value, traceback)
  File "requests\packages\urllib3\response.py", line 316, in _error_catcher
    raise ProtocolError('Connection broken: %r' % e, e)
requests.packages.urllib3.exceptions.ProtocolError: ('Connection broken: OSError("(10054, \'WSAECONNRESET\')",)', OSError("(10054, 'WSAECONNRESET')",))

During handling of the above exception, another exception occurred:

Traceback (most recent call last):
  File "conda\fetch.py", line 421, in download
    for chunk in resp.iter_content(2**14):
  File "requests\models.py", line 722, in generate
    raise ChunkedEncodingError(e)
requests.exceptions.ChunkedEncodingError: ('Connection broken: OSError("(10054, \'WSAECONNRESET\')",)', OSError("(10054, 'WSAECONNRESET')",))

During handling of the above exception, another exception occurred:

Traceback (most recent call last):
  File "conda\cli\install.py", line 405, in install
    execute_actions(actions, index, verbose=not context.quiet)
  File "conda\plan.py", line 643, in execute_actions
    inst.execute_instructions(plan, index, verbose)
  File "conda\instructions.py", line 135, in execute_instructions
    cmd(state, arg)
  File "conda\instructions.py", line 47, in FETCH_CMD
    fetch_pkg(state['index'][arg + '.tar.bz2'])
  File "conda\fetch.py", line 353, in fetch_pkg
    download(url, path, session=session, md5=info['md5'], urlstxt=True)
  File "conda\fetch.py", line 440, in download
    raise CondaRuntimeError("Could not open %r for writing (%s)." % (pp, e))
conda.exceptions.CondaRuntimeError: Runtime error: Could not open 'C:\\Program Files\\Anaconda3\\pkgs\\icu-57.1-vc9_0.tar.bz2.part' for writing (('Connection broken: OSError("(10054, \'WSAECONNRESET\')",)', OSError("(10054, 'WSAECONNRESET')",))).

During handling of the above exception, another exception occurred:

Traceback (most recent call last):
  File "conda\exceptions.py", line 479, in conda_exception_handler
    return_value = func(*args, **kwargs)
  File "conda\cli\main.py", line 145, in _main
    exit_code = args.func(args, p)
  File "conda\cli\main_create.py", line 68, in execute
    install(args, parser, 'create')
  File "conda\cli\install.py", line 422, in install
    raise CondaSystemExit('Exiting', e)
  File "C:\Program Files\Anaconda3\lib\contextlib.py", line 77, in __exit__
    self.gen.throw(type, value, traceback)
  File "conda\cli\common.py", line 573, in json_progress_bars
    yield
  File "conda\cli\install.py", line 420, in install
    raise CondaRuntimeError('RuntimeError: %s' % e)
conda.exceptions.CondaRuntimeError: Runtime error: RuntimeError: Runtime error: Could not open 'C:\\Program Files\\Anaconda3\\pkgs\\icu-57.1-vc9_0.tar.bz2.part' for writing (('Connection broken: OSError("(10054, \'WSAECONNRESET\')",)', OSError("(10054, 'WSAECONNRESET')",))).
Feel free to email me with the order-of-execution for this one (please understand that I didn’t actually bother to figure out the answer myself… that’s the whole point of this article).
Drawing on the code
Back to the original puzzle, so that we can discuss the subject without accidentally frying your brains. What is it really that makes this unnecessarily hard? A first observation is that it is a puzzle at all. That is: the stacktrace isn’t laid out on screen in the order of execution. This is a problem because it forces you to mentally rearrange the lines to figure out what happened.
This, in turn, happens because of the chaining of exceptions: when an exception is raised during the handling of another exception, the stacktrace is split into two parts. The first part shows the original exception, and the second part shows the new exception.
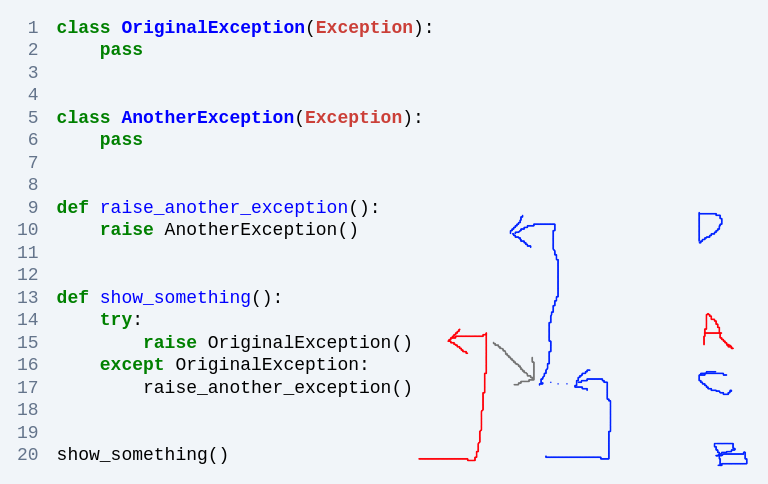
Before trying to get a better textual representation, let’s do some drawing on our code, to get a better mental model of what’s going on:

In this image, the two stacktraces of our chained exception are both represented.
- The red arrows correspond to the first half, the
OriginalException. - The blue arrows correspond to the second half, the
AnotherException
If we map this back to the stacktrace of the original puzzle, hopefully we can finally really wrap our heads around the answer. The flow of the execution was as follows:
- We start with the red line, at B, line 20. There is a call to
show_something(), which is excuted until… - the tip of the red line, A, line 15, raises an exception. Through the magic of try/except we then reach…
- the start of the 2nd blue arrow, C, line 17, where
raise_another_exception()is called, which is executed until… - the tip of that blue line, D, line 10 raises an exception
Note for the confused: the arrows do not mean “the execution jumped from the start of the arrow to the tip”. They mean: “if you follow the arrows in the reverse direction, you’ll go one level up the call-stack”. Actual execution has gone for the start of the arrow to a function surrounding the tip, and then step-wise to the tip until at that point an exception was raised.
Frames gone missing
With an eye on this picture, another thing may also become more apparent: the stacktrace, as presented by Python, is incomplete. Of the red arrow, only the tip, “A” is shown. The start of the red arrow, “B”, is missing from the stacktrace. In the more general case: all frames that are common to both exceptions are missing from the stacktrace of the original exception.
As far as I can tell, this is the result of an intentional decision by the Python developers: they have decided to prioritize succinctness.
Arguably, removing the redundant parts does make it easier to see for the original exception which
frames are unique to that exception. In our example: (“A”) is the only part of the OriginalException
stacktrace that is unique to that exception.
However, as we’ve seen, it also makes it much harder to piece together the full story. In particular: the combination of stacktraces cannot be read top-to-bottom anymore. The very first thing you see is already in the middle of the execution of the program. And starting at the top of the second stacktrace doesn’t help either, because from there it’s not clear how to relate back to the first stacktrace.
By the way, I think that Python’s specific wording makes this even more painful:
During handling of the above exception, another exception occurred
To me, this single line tells a chronological story: first the “above exception” happened, and then the “another exception”. That in turn gently nudges you into reading the stacktraces from top to bottom.
Is Python unique in this? I’ve checked a few other languages and haven’t yet discovered Python’s decision elsewhere. Java, for example, just shows the full stacktrace for each exception. I can’t really tell whether the option to prune was considered and then decided against, or whether it was just never considered. Whatever the case, it’s clear that the decision to prune has a significant impact on the readability of the stacktrace.
The missing link
So, should we just add the duplicated part of the traceback back into each exception and call it a day?
Not quite: even in that case, the actual link between the two stacktraces would still be implicit, rather than explicit. Let me break out the grey pencil in my advanced graphic tool to illustrate:
The grey line is the missing link, the relationship between the two stacktraces. We can think about it in multiple equivalent ways:
- an arrow from the
tryblock (specifically: the line of which triggered the first exception) to theexceptblock (specifically: the line of the block which triggered the second exception) - an arrow connecting the respecive first unique frames of the 2 stacktraces
You might even say it’s this arrow that represents the “chaining” of the exceptions. It’s the thing that represented by the text “During handling of the above exception, another exception occurred”
For non-pruned stacktraces (i.e. Java), this link can be reconstructed by putting the two stacktraces next to each other and visually identifying which parts they have in common. The first unique frames to both stacktraces represent the “during the handling” part of the story. That’s a UX-nightmare, but at least the information is there.
In the case of the pruned stacktrace, half the information is readily available on-screen: since the original exception is presented pruned fashion, just start reading at the top to find outh which is the first unique frame of that exception.
The trade-off is that the other half of the information is missing entirely: what the first unique frame of the second exception is is not shown. In fact, it cannot even be inferred from the stacktrace, not even when referencing the source code.
Bugsink’s take
My personal interest in Stacktraces is heavily influenced by my work on Bugsink, a tool for error tracking with a key role for stacktraces.
I spent quite a bit of effort on making sure that Bugsink’s stacktraces provide as much insight as possible. My first efforts were directed at plain-old (non-chained) stacktraces, but the better those looked, the more clear it became how confusing chained exceptions are.
And that’s where the puzzle came from originally: it’s the example that I played with in Bugsink to evaluate how to make sense of chained exceptions in the Bugsink UI. Here’s the result:

I’d like to think that with the annotations, the puzzle is much easier to solve:
- → begin is used to show where the control-flow begins
- during handling of the above tells you to look at the other stacktrace first and continue at “during handling” after
- raise Exception, possibly annotated with (handled), is used to annotate the points of raising.
Unfortunately, the above image contains a small lie: the “during handling” part is not actually annotated, because as I’ve mentioned before, that information is not available in the stacktrace and cannot be inferred from it either.
Still, I like to think it that even without that annotation, Bugsink’s stacktraces are much easier to read than Python’s default stacktraces.
If you like your stacktraces like that, install Bugsink, if even in local development only. Installing and then reading might just be faster than wrapping your head around an un-annotated version of the same exception.
For the rest of you… perhaps we should try re-opening this discussion at the language level?