Ad hoc sentry-sdk with “dsnrun”


TL;DR: dsnrun is a small utility that lets you run any Python script with sentry_sdk enabled, sending errors to your
favorite error tracking tool. It’s a handy way to get more context when debugging scripts for which error tracking isn’t
already set up.
Introduction
Imagine you’re creating a small Python script, and you run into an exception. Your screen fills with a plain-text stack trace. For the simplest errors, that might be enough to debug the issue, but what if you could get some more context?
Here are a few things that could make debugging easier:
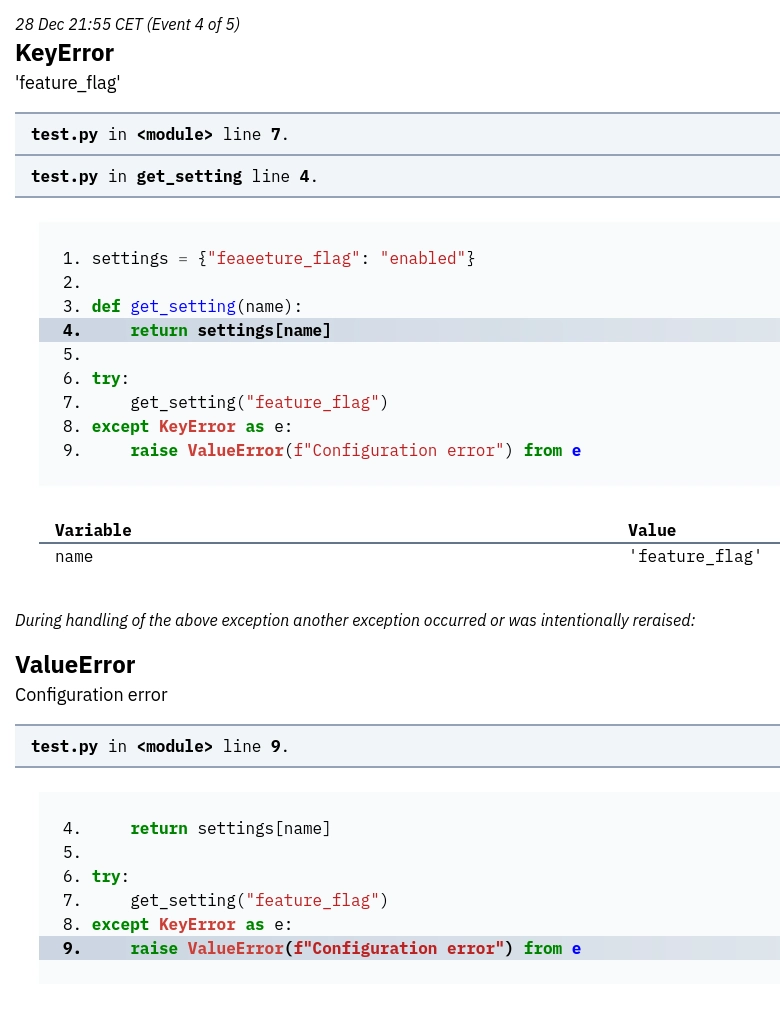
- See all local variables at a glance: Errors are logged with full context, making them easier to debug.
- Context lines: lines above and below the error line are shown, making it easier to understand the error.
- Highlight your own code: Your own app’s lines are in boldface, leading you to more likely suspect lines first.
That’s where dsnrun comes in. It lets you send errors from any Python script to your error tracking tool – complete with
stack traces and local variables – by initializing sentry_sdk with a specific DSN before kicking off the script
itself.
Why dsnrun?
I created dsnrun to scratch my own itch, while working on Bugsink, my self-hosted error tracking tool.
I use Bugsink in production for my own applications, but I quickly realized how valuable it could be during local development too. In short: Bugsink’s traces are more helpful than plain text stack traces, the context is preserved, and I can revisit errors later.
For “real applications” (web apps, APIs, etc.), this is a no-brainer, and your sentry_sdk setup is probably part of
your app’s initialization. From there, it’s a small step to use it in local development too (using e.g. environment
variables).
However, what about one-off scripts? Those probably don’t have sentry_sdk setup. You could copy-paste your sentry_sdk
setup into each script, but that’s a hassle and pollutes your scripts with unrelated code. dsnrun automates this
process, letting you run any Python script with sentry_sdk enabled.
Let’s first show what this looks like in practice.
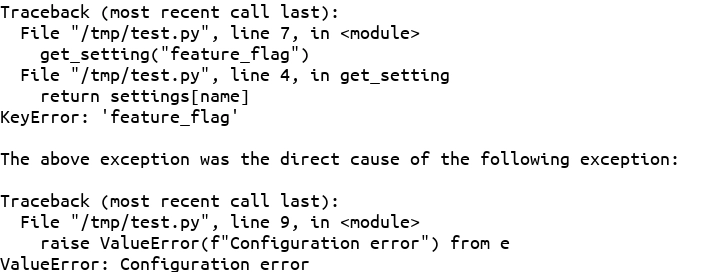
Example: Plain Text
Here’s what a plain text stack trace might look like in your console:

Example: in Bugsink
The same error in Bugsink looks like this:

How It Works
dsnrun wraps your script using Python’s runpy module, making it compatible with any script or module that you can
run from the command-line, whether it has an if __name__ == "__main__"-block or not.
It initializes sentry_sdk with a DSN you specify, sending errors to your error tracker (like Bugsink). Here’s how to
use it:
pip install dsnrun
Then, replace your usual Python command:
# Normal Python invocation: $ python -m failingmodule [..stacktrace..] # Using dsnrun: $ dsnrun -m failingmodule
Or:
# Normal Python invocation: $ python /tmp/failingmodule.py [..stacktrace..] # Using dsnrun: $ dsnrun /tmp/failingmodule.py
Now, instead of a plain text stack trace, you’ll find the error in your tracker, complete with local variables and a clean, revisitable history.
Why Not Just Use a Debugger?
Debuggers are great, but they’re not always the best fit. With dsnrun:
- No need to start your IDE in debugging mode, just rerun the script from where you were (e.g., in a terminal).
- You see all local variables at once, not just the ones in the current frame.
- Errors are logged for later review, so you can return to the problem after working on something else.
Sometimes, you want the interactive experience of a debugger. Other times, you just need to preserve the error for later
analysis. With dsnrun in your toolbox, you can choose the right tool for the job.
Limitations & Objections
dsnrun is very much a 0.1 version. It’s a handy utility to give a spin but not something to rely on for anything
serious. For details on its limitations, see the README.
You might wonder whether dsnrun is big enough to be its own package. Isn’t this the
left-padization of the Python ecosystem? I don’t think so: if
it’s useful, it’s worth sharing.
And if the people over at Sentry think it’s a good idea to include this in their SDK, I’d be happy to see it there.
Conclusion
dsnrun is a lightweight tool for running arbitrary Python scripts with sentry_sdk enabled. It sets up error
tracking for scripts that wouldn’t otherwise use it, giving you stack traces with full local variables and a history of
errors to revisit later. Whether you’re using Bugsink or another sentry-sdk-compatible tool, it’s a great addition to your
workflow. Try it out, and let me know how it works for you!
You can find the code and contribute at GitHub.
And if this article makes you think “those people over at Bugsink seem to have an unhealthy obsession with error tracking”, you’re quite right! If you want to reap the fruits of that obsession, install Bugsink and see for yourself!
