Local variables as accidental breadcrumbs


While working on Bugsink, I spend a lot of time thinking about how exceptions typically happen, and what factors are helpful (or not) in quickly fixing them. Some of this time is spent while I’m doing RealProductDesign™, but most of it is right after I step back from fixing an actual error as it happened in Bugsink or one of the related projects.
This blog post is a reflection on those thoughts and experiences, focusing on how local variables play a crucial role in effective debugging, and what this might mean for my (or your) coding style.
TL;DR: Directly seeing the values for local variables in your stacktrace is invaluable for debugging – in fact it’s one of the main reasons Bugsink is so useful. However: what actually gets captured depends on how you write your code: simple functions with local variables are much easier to debug than complex classes or overly-inlined code.
Exceptions and their causes
Exceptions typically don’t happen where the error in your code is. In fact, they often happen a few lines after the actual error. Typically: one function’s output is passed to another function, which then raises an exception because of invalid input.
Let’s look at a simple example function to illustrate this point.
def calculate_something(): big_number = get_big_number() small_number = get_small_number() return math.sqrt(big_number - small_number)
Because the math.sqrt function can’t handle negative numbers, this function will raise an exception if big_number
is less than small_number. However, even though the exception is raised by the math.sqrt function, the actual
problem may in fact be in any of the following other places:
get_big_number’s implementation is wrongget_small_number’s implementation is wrong- The assumption that
big_numberis always greater thansmall_numberbeing wrong
(Given the rather hypothetical nature of this example, it may be in even more places, but let’s stick with these for now)
Stacktraces and local variables
Now let’s assume you use a tool like Bugsink to track errors in your application.
When the above function raises an exception, Bugsink will capture the error and show you the stacktrace. The stack
trace will show you the line where the error occurred (the math.sqrt line), as well as the lines that led up to that
line.
More importantly, the stacktrace will show you the values for the local variables as they were at the time of the
error. In this case, the values for big_number and small_number. Assuming you have some mental model of what these
numbers should be, you can quickly use their actual values to map the error back to its root cause:
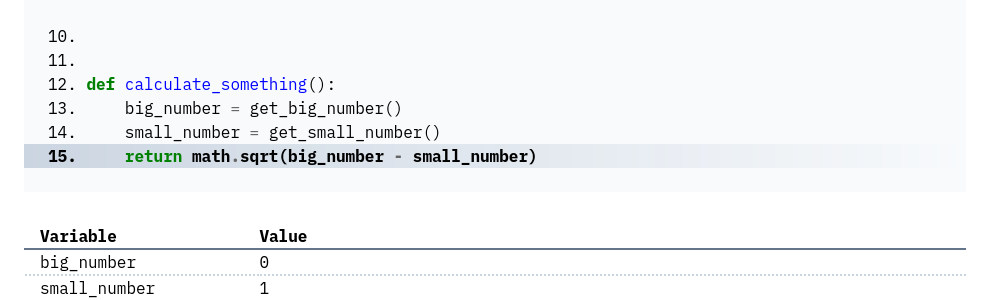
Despite not knowing much about our hypothetical example (we made it up after all), you can see how this
can help you quickly identify the root cause of the error: the starting point here would
probably be the “big number” of 0.
But here’s the thing: the quality of this context depends on how you write your code. In the version of the function above, the local variables are explicitly defined, and you actually get to see something.
Local-variable-poor code
Now, let’s consider a version of the function where the local variables are not explicitly defined:
def calculate_something(): return math.sqrt(get_big_number() - get_small_number())
In this version, everything is inlined. When the math.sqrt function fails, the stacktrace will show you the error
at that line, but it won’t show you the intermediate values for get_big_number() or get_small_number() because
they’re not stored in local variables:
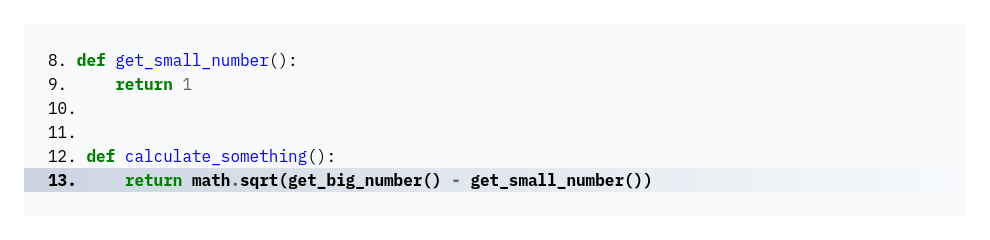
As you can see, the stacktrace doesn’t show you any values for intermediate results. You have to look up the function implementations to see what they might have returned to figure out what the actual values were at the time of the error. Depending on your setup, this may not even be possible.
More object-oriented code often suffers from the same problem. Consider the following version of the function:
class ComplicatedMath: def calculate_something(self): return math.sqrt(self.big_number - self.small_number)
In the class-based version, the key numbers are stored in attributes. When an error occurs, Bugsink will not
show these attribute values directly in the stacktrace at all (unless the ComplicatedMath class’ __str__ method
happens to be implemented to return the values of these attributes)
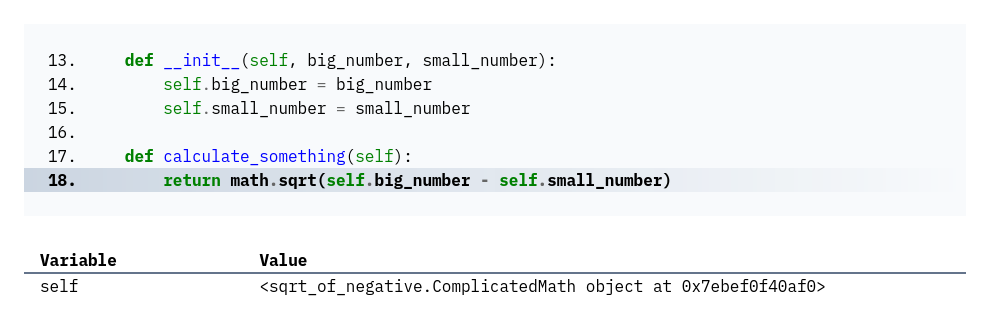
As with the inlined version, you lose the information that helps you quickly understand what went wrong. And as with the inlined version, reconstructing the actual values of the attributes at the time of the error can be a real pain or even impossible.
“Just capture more”
You might be thinking: “Doesn’t this just prove that Bugsink isn’t good enough? Why not just capture more information?” If Bugsink could capture everything, maybe the lack of explicit local variables wouldn’t be a problem. But here’s the reality: any tool must decide what to capture and what to leave out. Capturing “everything” would lead to an overwhelming amount of data per error which is literally infeasible. So any tool must make a cut-off somewhere.
Local variables are actually a pretty sensible such a cut-off. They represent the immediate context at the point of failure, the exact state of what’s happening in that function. They are easy to capture because they are scoped to the current execution. Trying to capture object properties, all attributes, or even deeper context introduces more complexity and noise, which makes it harder to pinpoint what’s actually relevant.
Also, we’re reusing (AKA “borrowing”) the Sentry SDK, so unless we take extra action, we’re tied to their choices about what gets captured. In fact, though I’m generally quite critical of many of Sentry’s recent design decisions , I think they’ve made the right call in this case.
Local Variables and Assertions
You might also say “Well, if you can’t capture more, why not just raise the error closer to the source?” This is in fact a good point. The most straightforward way to get errors closer to the source is to be more explicit about what you’re assuming, which is to say: add assertions to your code.
In our examples, the errors came from implicit assumptions (either big_number always being greater than
small_number, or some other implicit assumption about those calculations). Adding assertions would make these
assumptions explicit, pushing the raising of the error closer to its actual source.
In practice, it’s sometimes hard to be fully explicit every assumption we make. First, we might not even be aware of all the assumptions we’re making. Second, adding assertions everywhere can make the code harder to read and maintain.
Luckily, the advantages of local variables provide a stepping stone to an even more explicit approach using assertions: once you have local variables and a stacktrace with “funny values” for them, it’s easier to add assertions to validate the associated assumptions.
Local variables in your IDE
The advantages of local variables aren’t just limited to error tracking tools like Bugsink. They also make your life easier when debugging in your IDE.
Modern debugging tools allow you to step through your code and examine variables while doing so. Having the variables you’re interested in as local variables makes this process easier, providing the context right in front of you.
In a typical IDE, you can see the local variables at each step of the debugging process. Compare this to the inlined or object-oriented versions of the function, where you’d have to either setup an explicit watch expression or navigate through the object’s attributes to see the values.
What’s with the breadcrumbs?
“Breadcrumbs” are a metaphor for the trail of information that leads you back to where you came from. Sentry’s SDKs use and explicit breadcrumbs API to capture additional context that can help you understand what happened before an error occurred, such as user interactions or network requests, and when you use Bugsink as your error tracking tool, you can see these breadcrumbs in the error details.
However, the local variables are a different kind of breadcrumbs. They’re not explicitly set by the developer, but they are there anyway. They’re like the accidental breadcrumbs that help you retrace your steps when something goes wrong. And often, they’re the most useful breadcrumbs of all.
Takeaway
So what’s the takeaway from all this?
First, what should it mean for your coding style? Should you really change your coding style just for better debugging? My personal answer is: not just for that, but it’s one thing to keep in the back of your mind.
For me personally, it’s one of the factors that pushes me away from complex classes and towards simple functions. It’s also one of the reasons I prefer not to inline everything, and to keep intermediate results as local variables. Not just for the enhanced debugging experience, but also for the improved readability and maintainability.
Second, what does this mean for tools like Bugsink, or the associated client-side SDKs? Can anything be improved here? I think so: Examples like the above do hint at certain other candidates for capturing more context.
The most obvious example from the above is the attributes of an object. In the object-oriented version of the function,
the attributes of the ComplicatedMath class are the most relevant context. However, Bugsink doesn’t capture these
attributes by default. Capturing object attributes might well be worth it, as they are often the most relevant context
in an object-oriented program.
Now that you’re here: Bugsink is a simple, self-hosted error tracking tool that’s API-compatible with Sentry’s SDKs. Check it out